
How many hours a day do you spend in front of the charts trying to guess the direction of the market? Most traders blow their capital the moment they try to predict every random price movement, endlessly entering questionable trades. However, Stacey Burke built his methodology on the conviction that consistent profitability requires a radical shift in how you perceive and execute trades.
Burke's core principle is the 90/10 rule, which states that 90% of all profits come from just 10% of trades with an asymmetric risk-to-reward ratio (from 1:2 to 1:10). Everything else he calls "junk trading" — a blend of impulsive entries, emotional overtrading, and pip-chasing that ultimately destroys trading accounts. Most traders know the pattern all too well.
According to Stacey Burke, just one or two well-calculated trades during a couple of hours on the screen will yield far more than an entire day of chaotic clicking and endless stress. His rule, "No setup, no trade," sounds very convincing and appealing. But is everything really that simple and straightforward with the patterns the author describes? In this review, we'll break down in detail what Stacey Burke actually teaches in his Best Trade Setup Playbook course.

Three market outcomes at key extremes
Let's set aside all the complex indicators and classic chart patterns for a moment. What does the market actually do? According to Stacey Burke, the answer is remarkably simple and forms the foundation of his entire methodology. He argues that price has only three possible behaviors when approaching a key level. That's it. No secrets, no magic:
- Breakout and Continuation. Price decisively breaches a level and, instead of pulling back, consolidates on new ground. This is a clean, definitive shift in control. The trend becomes your friend, and momentum carries you toward the next zone. It feels great when everything goes according to plan, doesn't it?
- Failed Breakout and Reversal. This is where the real money is made. Imagine a bull charging full speed, smashing through the gate, only to realize there is a cliff right in front of him. Price breaches the boundary — often intentionally to hunt stop-losses — and then violently snaps back inside the range. In this scenario, breakout traders are trapped, and the sharp reversal squeezes them dry. Most traders have found themselves on the wrong side of that move at least once. It's pretty brutal. Burke considers false breakouts the fuel for the most powerful price impulses across three-day cycles.
- Range and Rotation. The market chops back and forth, rotating between established boundaries with zero intent to expand the range. This consolidation leads neither to a breakout nor a reversal — just a frustrating sideways grind capable of testing any trader's patience.
As a result, every trading day begins by answering a single question: which of these three scenarios is unfolding right now?
HOD and LOD as key intraday reference levels
As his primary daily reference points, Stacey Burke uses yesterday's extremes — Yesterday's High (HOD) and Yesterday's Low (LOD). Why invent complex formulas when the bulk of retail stop-losses and breakout orders are clustered right beyond these levels?
HOD and LOD serve as the structural framework of this trading method. They not only show you where you are, but also help project potential "Strike Zones" within the session. By mapping price expansion levels from yesterday's extremes, a trader can anticipate where a move is likely to exhaust itself — and where the odds of entering with a tight stop-loss and massive asymmetric upside are at their highest.
How higher time frames reveal where big money is moving
While intraday extremes dictate the tactical balance of power between buyers and sellers, weekly extremes (HOW/LOW) and monthly levels act as strategic barriers. What happens when the market approaches the high or low of the week? Liquidity spikes dramatically. These are critical structural levels where institutional players — the "smart money" — become far more active. This is where the real battle begins.
By understanding the mechanics of these three outcomes at key levels, you stop guessing where price will go. You simply wait for the market to test a boundary, confirm one of the scenarios, and clear the path for a clean, systematic trade.
How the pump-and-dump market cycle traps traders
Have you ever entered a position in the direction of a strong, confident trend, only to watch price reverse just a few candles later and tear in the opposite direction at relentless speed? You stare at the chart, take a stop-loss hit, and wonder what on earth just happened. The answer is simple: you become an exit liquidity for someone else.
Stacey Burke believes that virtually all price movements across liquid assets — including currency pairs, gold, crude oil, and equity indices — follow a universal cyclical mechanic. The market does not move at random. At its core, it repeatedly plays out two primary scenarios: "Pump and Dump" (a bearish liquidation following an artificial pump phase) or its mirror image, "Dump and Pump" (a bullish liquidation following a prolonged sell-off).

To stop falling victim to this process, you need a clear understanding of how the trap operates. It consists of four distinct phases:
1. Frontside: Luring clients onto the "escalator"
It all begins with a directional expansion of the trading range. The market creeps steadily in one direction, grinding along like a slow-moving escalator.
What are traders feeling here? Breakout traders are consumed by the fear of missing out (FOMO). They hop on a moving train, entering positions at increasingly unfavorable prices. Meanwhile, counter-trend traders attempt to short the rally, only to have their accounts chewed up by persistent micro-breakouts and continuous higher highs. This phase creates a massive buildup of vulnerable positions on both sides.
2. Peak formation: The final trap
Eventually, the move reaches its climax. The market makes a final push beyond a key structural boundary (such as breaching the previous day's or week's high).
This is where the trap snaps shut. Traders who bought at the absolute peak of the breakout are now trapped. The breakout fails to follow through, their orders are locked in at the worst possible levels, and the market simply runs out of buyers willing to bid higher. This forms the "Peak Formation" — the ultimate high of the entire structure.
3. Consolidation: The pressure builds
After the peak forms, prices do not always drop immediately. More often, the market goes into a tight, horizontal consolidation directly below the high (or above the low).
This narrow consolidation outlines the precise geometry of the impending disaster for trapped positions. The market builds pressure, lulls retail traders into a false sense of security, and establishes a "deathline" — the level below which panic among trapped longs will trigger.
4. Backside: The rapid descent
Once everything is set, the market transitions to the Backside of the move. If the Frontside climb was slow and heavy, the drop is virtually vertical.
Trapped buyers' stop-loss orders are triggered, algorithmic breakout traders pile in, and a cascading wave of liquidations unfolds. Price plunges back toward the origin of the move like a falling elevator, slicing through support levels in minutes. This is what Stacey Burke calls the trader's goldmine: there is no second-guessing here, the trade delivers immediate feedback with minimal risk, and the mathematical edge is massive.
Here is what it looks like in the real market:
Pump-Dump

Intraday Pump-Dump

Dump-Pump

Intraday Dump-Pump

Fractal scalability: From a trading week to a single session
The most remarkable feature of this model is its complete versatility. The market is fractal, meaning this accumulation-and-liquidation cycle operates across every time frame:
- Multi-day weekly setups: A pump on Monday and Tuesday that culminates at the High of the Week (HOW), followed by a massive liquidation on Wednesday or Thursday.
- Inter-session rotations: A pump phase through the Asian and London sessions, followed by a violent dump right at the New York open.
- Intrasession impulses: Local expansions from the High to the Low of the day (HOD/LOD) that play out the entire sequence — from trap to take-profit — in just 1 to 2 hours.
Once you view the market through the lens of Pump & Dump cycles, the way you look at charts changes forever. You stop chasing price during the Frontside and start patiently waiting for the trap to spring, ready to capitalize on the fast, clean moves of the Backside.
The structural three-day market cycle
Have you ever caught yourself thinking that Monday is the ideal day to take a trade simply because it marks the start of a new trading week? Or eagerly waited for Tuesday to "finally start trading"? Stacey Burke turns this notion on its head. To him, "Day 1," "Day 2," and "Day 3" are not days of the week at all. They are strictly structural phases with zero connection to the calendar. A new cycle can easily kick off on a Friday, a Monday, or right after a major economic news release. Everything depends entirely on how price behaves — not what day it is. Feel the difference?
The reality is that the market does not reset its state just because the clock strikes midnight. It operates in multi-day cycles of position accumulation followed by forced liquidations. Burke's entire methodology relies on a precise mechanism: the Three-Day Cycle. Once you learn to identify exactly which phase of this cycle price is currently in, the meaningless noise on the chart transforms into a crystal-clear roadmap.
Structure days vs. calendar days
The first and most common rookie mistake is assuming that structural Day 1 must happen on Monday.
Forget the standard workweek for a moment. The market does not care what day is displayed on the calendar. A structural cycle is triggered by a specific market event: a genuine range breakout or a confirmed false breakout at a key extreme.
- Did the market print a sharp false breakout and reversal at the Low of the Week on a Friday? That Friday instantly becomes structural Day 1, pushing Day 2 to Monday and the climactic Day 3 to Tuesday.
- Did a major Fed rate decision drop on Wednesday, violently ripping the market out of a multi-day consolidation? That catalyst marks the start of a brand-new Day 1 count.
To trade Stacey Burke's methodology successfully, you must stop looking at the calendar and start tracking raw market mechanics.
The anatomy of a three-day cycle

By observing the development of a three-day structure, you are effectively watching a market trap unfold step by step:
- Day 1 (Initiation Phase): The cycle begins with a directional expansion. Price breaks beyond the previous day's extremes (HOD/LOD) or prints a false breakout on a higher timeframe. This day sets the directional vector and lures the first wave of breakout traders into the market.
- Day 2 (Accumulation & Setup Phase): Other Time Frame (OTF) participants join the move, reinforcing the directional momentum. Day 2 often acts as the Trigger Day, forming setups such as First Red Day (FRD), First Green Day (FGD), or an Inside Day. Through this process, the market constructs the exact geometry of the coming trap.
- Day 3 (Climax & Liquidation Phase): The resolution. The market has accumulated two full days of open positions. When price makes a final push to draw in a third wave of breakout traders, the move exhausts itself. What follows is an explosive parabolic squeeze or a vertical collapse: trapped traders capitulate, unlocking high-probability setups with asymmetrical risk-to-reward ratios (from 1:5 to 1:10).
"Pump days" vs. "dump days"
To accurately gauge the potential of an upcoming price move, Burke categorizes trending sessions into Pump days (aggressive upward price pumping) and Dump days (directional downward distribution).
Price behavior on these days reveals the maturity of a weekly move. If an instrument has been pumped straight up without pullbacks for three consecutive days right into the High of the Week, does it make sense to buy at that absolute peak? Of course not. Long positioning is overextended, buyers are about to be trapped at the highs, and the sharpest players in the market are positioning for a massive Backside sell-off.
The iron rule: "Do not countertrend" on Day 1
Stacey Burke's primary risk management rule — designed to protect trading capital from instant destruction — is dead simple: Do Not Countertrend (DNC) on Day 1 of a true breakout.

When the market executes a powerful initial breakout through a key level or trading range boundary, many traders make the fatal mistake of fading it: trying to call "overbought" or "oversold" levels and stepping directly in front of heavy institutional order flow.
Burke's rule is non-negotiable: never trade against the trend on the day of an initial breakout. Let the market complete its structure across Days 1 and 2, wait for a confirmed setup to take shape, and catch the clean reversal trade on Day 3. Why step in front of a runaway train when you can simply wait for it to reach its final stop?
Once you grasp this cyclical rhythm, you will view the market through an entirely different lens. You will no longer see chaotic clusters of random candles, but an orderly sequence of phases driving toward a clear, logical conclusion.
Opening range and weekly structure explained
The start of a trading week often feels like nothing more than a chaotic cluster of random candles. That feeling only intensifies if you try to react to every price tick from the moment you boot up your trading terminal. Look at the market through a wider lens, however, and it becomes obvious that the five-day workweek follows a strict internal geometry.
In his Best Trade Setup Playbook course, Stacey Burke breaks down price behavior into clear structural elements where the first forty-eight hours dictate the blueprint for the rest of the week.
Monday opening range (OR): The week's key reference point
Monday is rarely meant for aggressive position building. Typically, at the start of a new trading week, market participants establish what is known as the Opening Range (OR), which maps out the baseline volatility boundaries and tests the reaction to the previous Friday's close. Did price break Friday's extremes to trigger a Day 1 directional breakout, or did it remain trapped inside Friday's range as an Inside Day? Regardless of how price trades from there, Monday sets the tone for the entire week, with its high and low serving as your first critical reference points.
Tuesday initial balance (IB) and the week's key extremes
On Tuesday, the market structure comes into sharp focus. Burke borrows the concept of the Initial Balance (IB) from classic market profile theory to define the combined trading range of Monday and Tuesday.
On Tuesday, prices will either expand beyond Monday's boundaries or test them to form a false breakout. Burke's observations show that, in the vast majority of cases, the "Monday + Tuesday" combination definitively locks in one of the week's key extremes:
- By the end of Tuesday, either the High of the Week (HOW) or the Low of the Week (LOW) is reliably locked in.
- That boundary holds for the remainder of the week, turning the opposite extreme into the primary target for a directional trend or squeeze.
Knowing which boundary has already been locked in by smart money removes the guesswork from your mid-week trade direction.

Range expansion and strike zones
By tracking standard measured moves across different asset classes, Burke builds working hypotheses on whether a trend still has fuel or is nearing exhaustion:
- Currencies (FX): Target expansion levels of 75 / 150 / 250–300 pips.
- Gold and Crude Oil (XAUUSD / WTI): Expansion grids of 150 / 250 / 300 / 500 / 750 pips.
- Equity Indices (S&P 500, NAS100, DJ30): Impulse boxes of 250 / 500 / 750 points.
These levels reflect the average distance of three consecutive impulse legs within a trend. Once price has traveled through three levels within these standard ranges, the available liquidity driving the trend is typically exhausted.
The overextension principle and knowing when to switch sides
Consider a concrete market scenario: by Wednesday, a currency pair has plunged roughly 167 pips without a meaningful pullback. An inexperienced trader sees a steep drop on the chart and opens short positions on a breakdown, desperate not to miss the move.
Under Burke's methodology, this is an unacceptable mistake. Once price extends beyond the standard 150-pip grid, all trend-continuation entries in the direction of the impulse are strictly off-limits.
Price has entered deep overextension. Selling at these levels means risking getting trapped right at the bottom of the move ("jamming into the low").
The moment an asset exhausts its average weekly range, a Burke trader immediately pivots to looking for a Peak Formation Reversal. At these extremes, late sellers get trapped, creating the perfect fuel for an explosive short squeeze back toward the opposite boundary of the week.
Trigger days as signals, not entry points
Most traders stumble over the exact same thing: they spot a textbook candlestick pattern on the daily chart and instantly hit the "Buy" or "Sell" button. Stacey Burke strictly warns against this kind of haste.
In his system, a Trigger Day is not an order to "enter the market right now." It is merely a yellow traffic light serving as an advance alert. Its purpose is to highlight a specific instrument on your watchlist. Think of it as a signal: "Pay attention — the conditions for a Best Trade Setup (BTS) are ripening here for the next trading day." However, executing an actual trade always requires confirmation on lower timeframes within a strictly defined time window.
Each type of Trigger Day reveals precise information about which market participants have been lured into a trap.
1. First red day (FRD)
A short setup that is always preceded by a strong upward run — a "Pump Day."
This day must close below its open price — hence the name "First Red Day." What does this tell us? Buyers were aggressively driving prices higher, but by the end of the day, sellers seized control.

As a result, trapped buyers are locked in at the very top. When the market breaks structure and takes out support the following day, these traders capitulate, providing the ideal fuel for a rapid, vertical sell-off.
2. First green day (FGD)
The First Green Day is the mirror image designed for taking long positions. It is preceded by an extended or aggressive drop in price (a Dump Day).
When, after a prolonged decline, a trading day closes above its open price, an FGD setup is triggered.

The mechanics behind this model are simple: short sellers who entered at the very bottom hoping for trend continuation find themselves trapped. The following day, their stop-losses and panic market liquidations trigger a powerful short squeeze, driving price upward in a parabolic trajectory.
3. Inside day (ID) and double inside day
When an instrument's entire daily range is contained within the high and low of the previous day, an Inside Day (ID) forms on the chart.

This market condition is like a compressed spring: volatility contracts while the market builds liquidity. Stacey Burke outlines two primary outcomes for trading this compression:
- False Break Reversal: The Asian session lures breakout traders into breaching one boundary of the Inside Day, after which price reverses and tears toward the opposite edge of the range to sweep stops.
- Continuation Blowout: A true momentum breakout from the consolidation, followed by a powerful, one-way trending move.
If a Double Inside Day forms — two consecutive days of range compression — prepare for a massive, explosive expansion. These setups do not occur often, but when they do, they frequently produce the biggest trades of the week.

4. Day 2 / Day 3 breakouts
These Trigger Days track the momentum and participation of breakout traders.
When the market takes out the previous day's extreme and holds that level, Day 2 Breakouts enter the market. This is a clear signal of trend continuation.
By Day 3 (Day 3 breakouts), however, the move reaches peak saturation: this third wave of breakout traders is usually the final one, creating the conditions for severe exhaustion and a major structural reversal.

5. Failed breakout days
These days close with a deep pullback after an unsuccessful attempt to hold beyond higher-timeframe reference levels — such as the previous week's High or Low (HOW/LOW) or the monthly extreme.
The market feigns a trend continuation, but in reality, it only sweeps liquidity and traps breakout traders outside the level. When the daily candle closes back inside the previous range, it confirms a Failed Breakout and offers a high-conviction signal to seek reversal setups the following day.

The key takeaway: a Trigger Day simply sets the stage. Your job as a trader is not to rush in blindly, but to wait patiently for your session, gauge price reaction at key levels, and pull the trigger only when the lower timeframe confirms the completed setup.
Price geometry, strike zones, and market structure
When you open a five-minute chart without a clear map of price levels, the market looks like sheer chaos made of random bars. Stacey Burke believes the issue isn't a lack of data, but the lack of a proper hierarchy. Instead of dozens of indicators, his method uses hierarchical levels and discrete price expansion ranges. First, you look at the monthly, then the weekly, then the daily, then the session, and only at the very end — at the specific setup. Makes sense, doesn't it? You can't build a roof without first laying the foundation.
Timeframe hierarchy from global structure to setup
Decision-making in Burke's method is never based on a single-timeframe chart. The entire analysis unfolds strictly top-down through the sequence:
Monthly → Weekly → Daily → Session → Setup
This hierarchy is more than just a list of timeframes — it is a map. It shows you where you currently are and where you are headed. For instance, if the weekly chart sets a bearish tone and the day opens with a sharp rally, you instantly understand: this could be a trap before the downtrend resumes. Would you really buy in such a spot without checking the higher timeframe first?
Within this hierarchy, Burke highlights key structural levels. You are already familiar with HOD and LOD — the high and low of the day. But there are also HOS and LOS (the high and low of a specific session), as well as HB (High Bull) and LB (Low Bear) — the peak levels printed by aggressive buyers or sellers before consolidation begins. Keep this in mind: the more of these structural levels you track, the more clearly you see exactly where the market could reverse. This filter alone will help eliminate most questionable trades inside the range.

Three-level geometry for measuring price exhaustion
Now for the most interesting part: Burke uses geometry to project targets. Instead of guessing where price will go, he measures three levels of expansion up or down. These three levels are standard 25–50 pip boxes for currency pairs — for example, 75 pips for an intraday session and 150–250 pips for a three-day cycle. The key insight is that price typically exhausts and halts right around that third level. It functions like a staircase where each step brings you closer to a logical take-profit target.
A vital rule to remember: if an asset has already traveled through three standard expansion levels without a meaningful pullback before your trading session begins, taking trend-continuation entries becomes mathematically unfavorable. In this zone, your primary focus should be looking for signs of exhaustion and an impending reversal.
BIS and deathline as structural turning points
How do you confirm that market structure has truly broken? Burke uses precise markers. The first is a Break in Structure (BIS). This is the moment price stops making new extremes and begins reversing against the prevailing move. It is not just a routine pullback, but a clear sign that the direction of institutional order flow has shifted. For traders coming from an SMC background, Burke's BIS is functionally identical to a Change of Character (CHoCH) or lower-timeframe Break of Structure (BOS), signaling that immediate control has flipped. It typically looks like this: price takes out a local swing low within an uptrend (or a local swing high within a downtrend) and closes decisively beyond it.
Another crucial marker is the so-called "Deathline" or neckline. This is the structural level beyond which trapped traders are definitively caught on the wrong side of the market. Picture buyers who loaded up at the absolute highs, only to watch prices continually trade below their average entry, denying them any chance to break even. Once price drops below this line, unrealized losses balloon, and those trapped stops become the fuel for an accelerating collapse.
Stop-hunt zones
Finally, there are the stop-hunt zones. Burke points out that price frequently pushes 25–50 pips beyond yesterday's range. This is never random. He considers it a strong tell that institutional players have swept liquidity from breakout traders and are setting up a reversal. More often than not, that is exactly how it plays out: the moment that trapped buying volume is absorbed, the market violently snaps back inside the daily range, unlocking a prime entry in the direction of the true structural imbalance.
How session timing shapes trading setups
You can spend hours drawing levels and analyzing patterns, but if you enter the market at a random time, your expected value will trend toward zero. For Stacey Burke, the element of time carries the exact same weight as price itself.
The market does not offer high-quality opportunities evenly across all twenty-four hours. Its activity follows a strict schedule governed by the opening of major exchanges and the moments institutional players deploy capital.
New York time as the global standard
Stacey Burke's entire trading system, chart templates, and execution rules are anchored to a single time zone: New York Time (NYT).
Why New York? It standardizes the daily cycle, aligns with the synchronized 5:00 PM NYT daily candle close, and eliminates any confusion caused by local time zones. Regardless of where a trader is physically located, their charts are always calibrated to Wall Street time.
Trading sessions and the strict three-hour entry window
Now let's break down the sessions. If you study Stacey Burke's material closely, you will quickly run into one of the most confusing and widely debated topics within his community: session timing.
On one hand, Burke constantly repeats his core premise: "Time of day is just as important as price." On the other hand, there is a clear inconsistency in how he presents these session windows, sparking endless debate among traders trying to systematize his rules.
Where does this methodological discrepancy come from?
Contradictions in the source material
Looking at the master session summary table in Burke's playbook, we see distinct 4-hour blocks:
- Asian Session: 7:00 PM–11:00 PM NYT
- European / London Session: 1:00 AM–5:00 AM NYT
- New York Session: 7:00 AM–11:00 AM NYT
On the surface, this appears straightforward: standard four-hour windows of interbank market activity.

However, when you move to the step-by-step checklists for specific setups (such as First Red Day, First Green Day, or Day 3 Breakouts), you run into strict execution rules: "Only trade setups that confirm inside your 3-hour trading window" and "Trades are executed strictly within the 3-hour timing window."
A logical question arises: if a session lasts four hours, which three hours are the actionable trading window? Why does the author define a session as four hours in one place, yet abruptly shorten it by 60 minutes in the entry rules without specifying exact operational parameters for each individual instrument?
Separating observation time from the execution window
To untangle this contradiction, you have to look at Burke's personal routine and match it against market behavior. Describing his own daily schedule, Burke explicitly states: "I trade the New York session from 8:00 AM to 11:00 AM New York time."

The confusion stems from conflating two fundamentally different concepts:
- Session Window (4 Hours): The broader window of institutional liquidity in the market. The first hour is typically spent probing the range, running false pushes, or waiting for the day's initial news catalysts.
- 3-Hour Timing Window (3 Hours): The high-probability core of the session where confirmed setups are most likely to materialize.
- For New York, the execution window shifts to 8:00 AM–11:00 AM NYT, capturing key macroeconomic data releases at 8:30 AM and the surge in volatility surrounding the US Equity Market Open (Equity Hour) at 9:30 AM.
- For London, the prime execution window becomes 2:00 AM–5:00 AM NYT, centered around the opening of the European exchanges between 3:00 AM and 4:00 AM NYT.
While this terminology gap can easily confuse beginners, looking past the literal wording reveals a practical rule: the market provides four hours of deep liquidity, but that doesn't mean you should sit glued to the screen the entire time. Your goal is to focus on the three-hour window where cash markets open and news events hit, wait for price confirmation on the 15-minute chart, and execute in the direction of a clean impulse with minimal holding time and reduced market exposure.
If a setup does not form or fails your entry criteria within that 3-hour window, there is no trade. You shut down your terminal and walk away.
Temporal inflection boundaries
Beyond session windows, Burke places heavy emphasis on temporal inflection points: the opens of 15-minute, 1-hour, and 4-hour candles, as well as session rollovers and the start of the new trading day. Avoid jumping into trades mid-candle. Wait for the candle to close to ensure market structure remains intact.
Before entering any position, ask yourself: is this genuinely the right time to execute? Experience shows that without precise timing, even the cleanest chart pattern can fail in an instant.
The alignment of a key structural price level with a prime session window provides the "sniper's edge" that transforms trading from chaotic clicking into a disciplined, systematic process.
Stacey Burke trading setups explained
Now let's move on to the practical side: the setups on which Burke builds his trading. There are quite a few in his playbook, but an important caveat must be made upfront: these are not a "get-rich-quick button" or a set of guaranteed signals. All the models he outlines are structured as formalized playbooks called Best Trade Setups (BTS). Their common goal is to help the trader identify the optimal moment to enter when one side of the market is trapped, aiming to catch an impulsive price move with an asymmetrical risk-to-reward ratio.
1. Three-day setup (context)
This is not a standalone intraday signal, but the foundation of the entire system. It describes the three-day cycle of accumulation and distribution within classic Pump & Dump or Dump & Pump schemes. Over three sessions or three days, the market accumulates positions before unleashing a powerful reversal off the high or low of the week (or month). Without this context, intraday signals carry little to no value.

2. Day 3 longs and Day 3 shorts (intraday trigger)
One of the author's favorite setups, designed to exploit the greed of breakout traders. What happens when a trend runs for three consecutive days without pullbacks, breaking through extremes? The most vulnerable participants enter the market: Day 3 breakout traders.

This is precisely where the market snaps the trap shut: the momentum past the newly broken extreme exhausts itself, traders are trapped at unfavorable levels, and price violently snaps back inside the "deathline." The trade is executed as price re-enters the range, targeting the opposite boundary.

3. First red day (FRD)
A classic short setup. Following a strong Pump Day, the next session closes below its open, printing the FRD pattern. This indicates that buyers at the peak are trapped.

On the third day, the trader tracks the Peak Formation High or the High of Session (HOS) inside the timing window. The entry trigger is a bearish 5-minute candle close back below the 20 EMA, paving the way for a rapid sell-off.

4. First green day (FGD)
The mirror reversal model for long positions. Following an extended Dump Day, the market prints a session that closes above its open. Short sellers who shorted into the lows find themselves trapped in their positions.

The following day, after a local base forms along with a bullish engulfing pattern on the 5-minute chart, a long position is executed from the Low of Day (LOD). The trade relies on a cascade of triggered stop-losses from trapped shorts to drive price back toward the upper levels.

5. Inside day reversal / continuation
When an instrument's daily range is completely contained within the high and low of the previous day, the market compresses energy for an impending expansion. Burke approaches Inside Day compressions through two primary scenarios:
- Reversal (false break): In the morning, price aggressively pushes outside the Inside Day boundary, luring breakout traders into positions. Failing to hold the level, the market abruptly reverses and heads toward the opposite boundary of the range.
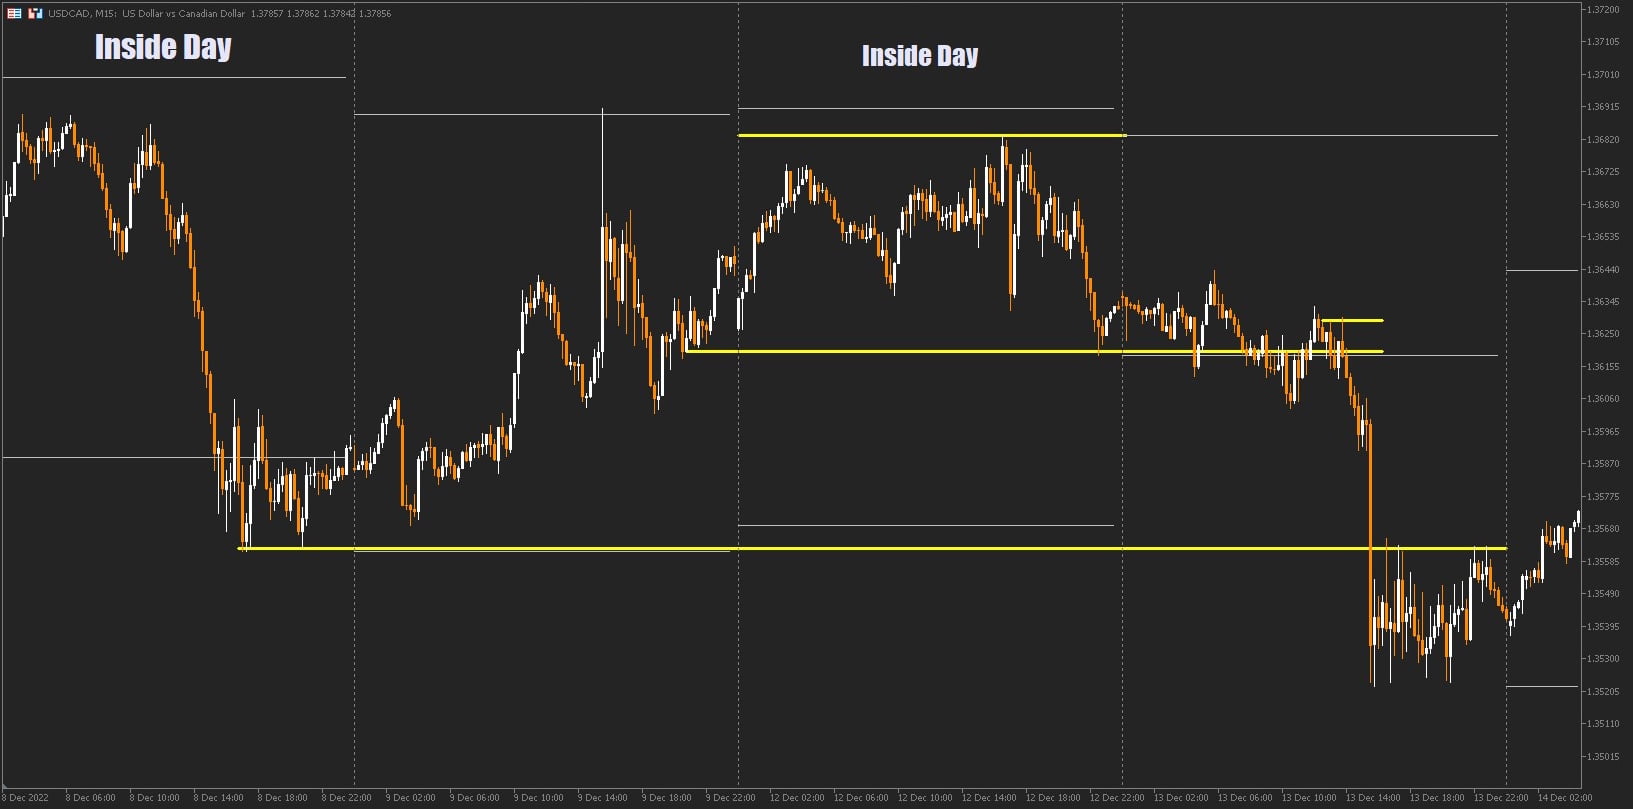
- Trend continuation: Price decisively breaks out of the range, sustains acceptance beyond it, and transitions into a clean directional trend.

6. Parabolic trend setup (Day "0" / 3-day rectangle)
A rare but exceptionally powerful setup. Over three days, an instrument remains in a tight horizontal balance, carving out a dense rectangular range — a so-called "Day 0."

Once a true breakout from this base occurs, the core rule applies: Do Not Countertrend (DNC). The market shifts into a rapid, virtually one-way parabolic expansion, with the profit target set at a 100% Measured Move extension of the initial range.
7. Parabolic three-session setup
This setup is a fractal replica of the multi-day cycle compressed into a single 24-hour period. The model develops sequentially across three sessions: Asia, London, and New York. For example, an instrument pushes through three discrete session levels — totaling 75 pips (25 × 3) on a currency pair — before putting in a climactic reversal at the New York open that rapidly collapses price back to the base of the day, liquidating built-up volume.

8. Parabolic short squeeze
An explosive long setup that takes shape after an extended downtrend. Day 3 short sellers enter near the lows of the week or month, after which a slow, "creeping trend" lower appears on the chart. However, each subsequent push lower meets responsive buying.

A sudden momentum break of resistance paired with a bullish engulfing candle triggers a cascade of short covering. Price launches into a parabolic surge, capable of covering 50–250+ pips in a matter of hours.
9. Low-hanging fruit (LHF)
This is arguably the simplest, most comfortable, and psychologically easiest setup in Stacey Burke's methodology. If the market has already established a true breakout and formed a trend on the previous day, the trader's goal is not to predict a reversal. During the session window, the trader simply waits for the first systematic pullback — typically 25–50 pips from the extreme. Once a 5-minute candle closes in the direction of the trend back across the 20 EMA, a position is opened targeting a continuation move of another 25–50 pips.

10. First bounce (news catalyst entry mechanism)
Important
Burke strictly advises against holding open positions directly into high-impact macroeconomic releases such as CPI, NFP, or interest rate decisions. However, the news momentum can be exploited after the release.
The First Bounce setup is traded under one strict condition: the 15-minute setup structure must already be fully established prior to the release. If the data accelerates price in alignment with that pre-existing structure, the trader avoids chasing the initial 1-minute spike. Instead, they wait 15–30 minutes for price to print its first technical pullback to the 20 EMA on the 1-minute chart, entering only then with a tight stop placed behind the local swing extreme.

11. Second-day news catalyst
This trade develops the day after a massive news-driven move, such as an FOMC rate decision. A major catalyst frequently serves as Day 1 of a new cycle, displacing price by 300–400 pips in a single impulse. On Day 2, the market generally follows one of two paths: continuing the trend during the Asian or London session, or printing a structural Backside Reversal if a climactic Peak Formation was already locked in during the news spike.

None of these eleven setups require sitting at your desk all day. It is enough to scan a focused basket of 5–10 instruments, identify an asset with an established structure, and execute a single high-quality trade inside your session window with discipline.

Burke does not suggest trading every pattern at once. On the contrary, the trader's objective is to master the models that fit their style and wait for the right market conditions. Ultimately, it comes down to a simple question: are you willing to wait patiently for your ideal setup so you can spend just an hour at the screen and take profits according to your plan?
Multi-timeframe trading execution explained
How many times have you entered a position based on what seemed like a textbook signal on a lower timeframe, only to realize minutes later that you essentially bought right into major higher-timeframe resistance? This multi-timeframe misalignment is one of the leading causes of chaotic trading and emotional burnout for most beginners.
To prevent this, execution in Stacey Burke's methodology is built upon a strict three-tier timeframe hierarchy. Each chart serves a clearly defined function and never replaces the others:

1. 15-minute chart context and setup geometry
Let's start with the 15-minute chart. This is your "command bridge" and primary analytical workspace. This is where the trader scans their watchlist every day during pre-market preparation.
You do not use the 15-minute chart for pinpoint entry precision. Its role is to define the day's structure, track key day counts (Day 1, 2, 3), map essential price levels, and wait for the overarching setup to take shape. Think of it as your terrain map before heading out on a hunt: without it, it's easy to get lost in market noise. If there is no clear context or confirmed BTS (Best Trade Setup) template on the 15-minute chart, dropping down to lower timeframes is completely pointless.
2. The 5-minute chart as the primary execution timeframe
Once the 15-minute context is fully established and price approaches the designated level within the session's timing window, you can transition to the 5-minute chart.
The 5-minute chart is the primary execution timeframe for the vast majority of setups. Here, the trader waits for price action at the key level: a decisive engulfing candle or a reversal pinbar/hammer with an extended tail. The actionable trigger to execute the position is a decisive 5-minute candle close across the 20 EMA in the direction of the trade.
3. The 1-minute chart for "first bounce" entries
Many traders drop down to the 1-minute chart trying to catch the absolute beginning of a move. In Burke's system, its use is strictly limited.
The 1-minute chart is applied in only one specific scenario: executing the First Bounce setup following high-impact macroeconomic data releases, such as CPI, NFP, or central bank interest rate decisions.
If the news-driven impulse expands in the direction of the pre-planned 15-minute context, chasing the very first 1-minute candle is reckless. The trader waits 15–30 minutes for initial volatility to settle, identifies the first technical pullback to the 20 EMA on the 1-minute chart, and opens the position with a tight stop-loss placed behind the local swing extreme.
The 20 EMA as an execution filter, not an entry indicator
Now to the most critical component: the role of the 20 EMA. It is neither a magic bullet nor an independent signal generator. The 20-period exponential moving average is plotted on the chart not for moving average crossovers or building dynamic channels.
In Burke's methodology, the 20 EMA functions as a mechanical confirmation filter designed to eliminate hesitation, second-guessing, and subjectivity at the moment of execution. Unlike traditional Smart Money Concept strategies that rely on blind limit orders placed inside Fair Value Gaps (FVGs) or Order Blocks, Burke enforces a candle close across the 20 EMA as a lagging, mechanical confirmation that the trap has closed and momentum has officially shifted. It simply verifies that price has already reversed and momentum is expanding in the anticipated direction. On its own, the 20 EMA never generates a setup — it merely confirms that a setup is ready to be executed.
Entry architecture with structural confirmation before the moving average cross
Keep in mind: a candle close on the other side of the 20 EMA is never enough on its own to justify opening a position. A trade is only valid when a strict three-step sequence is met:
- Peak Formation: The market makes a prior false expansion beyond HOD/LOD, a session extreme, or the boundary of a 4-hour consolidation, trapping breakout traders.
- Structural Rejection: A local Break in Structure (BIS), a pinbar rejection, or an engulfing candle confirms price is unable to sustain acceptance beyond the level.
- Final Trigger: Only after the first two criteria are satisfied does a candle close beyond the 20 EMA become the trigger for an immediate market entry with a predefined stop-loss.
Structuring timeframe roles this way strips out subjectivity: the higher timeframe provides the trade idea, the intermediate timeframe confirms the entry trigger, and the 1-minute chart is reserved exclusively for select post-news impulses.
Stacey Burke risk management and trade exit rules
Do you know what separates a professional trader from an amateur? Not the ability to spot winning trades, but the capacity to survive the day when everything goes wrong. Stacey Burke knows this better than anyone. His approach to capital preservation isn't just a set of dry numbers — it is a true survival system. Let's break down what he recommends.

Strict capital protection and risk limits
Before placing an order, the trader defines the exact level where the trade idea becomes invalid. A protective stop is never chosen arbitrarily: it is always anchored to a specific structural reference point — the peak of a Peak Formation or the extreme of the trigger candle.
In the forex market, the maximum stop-loss is capped at 15–20 pips, and in most instances, it does not exceed 15 pips. For commodities like gold and crude oil, as well as equity indices, the allowable risk is 20–25 points/ticks.
For certain high-precision momentum setups, a strict One-Bar Stop rule applies: the stop order is placed directly outside the trigger candle to keep risk to an absolute minimum. If price breaches the protective level, the trade is immediately liquidated at the predetermined loss. Averaging down, adding to a losing position, and widening stop-losses away from the entry are strictly prohibited. These rules are non-negotiable.
Profit-taking and strict take-profit rules
When it comes to profit-taking, Burke's approach is just as rigid. The minimum take-profit target is set at 50 pips. The logic is straightforward: a trader is in the market to extract profit, not to hold positions open for days on end.
In three-day patterns, targets can expand to 75, 100, or more pips — governed by a 100% Measured Move extension of the consolidation range. Crucially, a Hard Take-Profit limit order is placed at the exact moment of entry.
An ideal setup should resolve in a sharp, vertical impulse where price rapidly hits the predefined target at the climax of the move, locking in profit and relieving the trader of ongoing trade management. Burke also advises against manual trailing stops and partial scale-outs, noting that excessive micromanagement degrades the net positive expectancy of the system over time.
The speed rule and mandatory immediate exit
Once an order is filled, the trading hypothesis is tested against the clock. A high-quality 90/10 setup should yield a clean, directional impulse almost immediately. Rather than enduring hours of sideways chop in search of extreme 1:20 SMC-style reward ratios, a Burke setup demands instant velocity. If price stalls, chops around the entry, or devolves into a choppy range, The Velocity Rule takes effect.
Burke does not wait around for price to hit his stop-loss. If the market fails to sprint toward the target within the session window, time decay invalidates the premise, and the position is closed manually. Continuing to hold risk in that scenario makes little sense: the setup failed to demonstrate the required velocity, meaning the core thesis has broken down.
No overnight positions and no news trading
The final component: overnight holdings are completely off the table. To preserve capital, Burke enforces two uncompromising safety rules:
- Session boundaries: Trading is strictly confined to your chosen session window. Positions are ideally held for one to two hours, and holding trades overnight into the next day is entirely forbidden.
- No trading into news: You must never hold open positions during major macroeconomic releases — such as CPI, NFP, or FOMC rate decisions and statements. Slippage and violent price gaps turn trading directly through high-impact news into pure gambling; all open positions must be closed before the release.
The sole exception is the First Bounce setup. After the release, the trader avoids guessing the initial reaction, waits for the initial volatility spike to settle, and enters only on the subsequent technical pullback.
This is the practical core of the system. A solid trading methodology should protect a trader's peace of mind, not chain them to the screen all day.
From market context to trade execution
Instead of the usual chaotic trading and relying on gut feeling to guess future price direction, trading with Stacey Burke's system resembles a pilot's pre-flight checklist where not a single step can be skipped. Rather than hitting buttons and hoping for luck, you systematically assemble a puzzle where every piece is strictly dictated by the preceding step.

Step 1. Context. It all begins with evaluating the previous day. Was it a true breakout, a failed breakout, or standard range-bound consolidation? This context lays the groundwork for understanding the current day and sets the direction for all further analysis.
Step 2. Location. Next, pinpoint exactly where the price is currently situated. To do this, examine monthly, weekly, daily, and session extremes. These are the levels where the market most frequently reacts. Understanding your current location allows you to assess how far price has already traveled and what potential remains for the move.
Step 3. Day Count. Now determine the active phase of the cycle: Day 1, Day 2, or Day 3. Each phase has its own characteristic intraday dynamics and requires a corresponding game plan. If you lose track of where you are in the cycle, you lose your sense of timing and structural context.
Step 4. Trigger Day. Check whether the conditions confirming your trade hypothesis have materialized. Has a First Red Day (FRD) or First Green Day (FGD) formed? Perhaps the market printed an Inside Day or broke out of the Initial Balance? These structural triggers transition a trade idea from passive observation into an actionable execution scenario.
Step 5. Trapped Traders. Move to the most critical question: who is currently trapped — the buyers or the sellers? Map out where their protective stop-losses are clustered. These forced exits will fuel and accelerate the move once price breaks in your direction.
Step 6. Strike Zone. Calculate the three expansion levels of the current move and evaluate how far price has extended. If the market is overextended, avoid chasing it; it may be far wiser to wait for a reversal setup at one of the key levels.
Step 7. Setup Selection. Once context and location align, select the specific template from your playbook. This could be a Parabolic Short Squeeze, a Pump and Dump, or Low-Hanging Fruit. The essential requirement is that the choice is deliberate and fully supported by the current market structure.
Step 8. Timing. Time is decisive. Execute trades exclusively within your three-hour session window. There is no edge in opening positions as a session winds down. Your goal is to wait for the exact window when institutional volume enters the market and the highest-probability opportunities emerge.
Step 9. 15-Minute Setup. Before pulling the trigger, confirm that the higher timeframe validates your trade idea. Is price holding the key level? Does the structural integrity of the pattern remain intact? This step provides your final check before execution, filtering out invalidated setups.
Step 10. 5-Minute Entry. This is the moment of execution. Wait for a confirming candle close back across the 20 EMA. This functions as your mechanical filter to prevent premature entries. Once confirmed, enter the trade.
Step 11. 1-Minute Post-News Entry. If trading after a high-impact news catalyst, drop to the 1-minute chart and wait for the first technical pullback to the 20 EMA. This is an aggressive, high-precision entry mechanism designed to capture an unfolding post-news impulse.
Step 12. The Velocity Check. Immediately following your entry, monitor whether price expands with sufficient speed and direction. If price fails to demonstrate the expected acceleration within 15 minutes, exit the position. The lack of momentum is itself a clear signal that the trade hypothesis has failed.
Step 13. Exit. The final step. Once price hits your predefined take-profit target, shut down your trading terminal. Do not try to squeeze more out of the move or predict the next swing. Target reached, trade over.
Are you ready to follow this checklist from start to finish, or do you prefer relying on intuition? Burke maintains that only a disciplined, systematic approach transforms trading from a series of impulsive reactions into a consistent, rules-based business.
Stacey Burke vs. Smart Money Concepts (SMC) and the case for simplification
When studying Stacey Burke's methodology, it is easy to notice its resemblance to the Smart Money Concepts (SMC) approach. Both rely on a similar theoretical foundation — notably Michael Huddleston's ICT concepts and classical Market Profile theory — yet they offer vastly different levels of complexity to solve a similar problem: understanding market structure and building a sustainable trading model. Comparing these two frameworks highlights not only what unites them, but also their fundamental differences in practical execution.
Where the two methods align:
- Liquidity Hunting and Trap Mechanics: Both methodologies step away from classical technical analysis with its trendlines, flags, and chart patterns. Instead, they treat key extremes like HOD/LOD and HOW/LOW as high-liquidity pools where stop orders and breakout entries cluster. What Burke describes as a "false breakout" and "trapped volume," SMC typically frames as a "liquidity sweep."
- Structural Shifts: Burke's Break in Structure (BIS) serves a function closely aligned with CHoCH (Change of Character) and BOS (Break of Structure) in SMC. All of these concepts are used to identify a change in directional structure and the presumed shift in control from one side of the market to the other, even if the specific criteria and terminology vary between the two systems.
- Session Timing: Both approaches place heavy emphasis on time, viewing specific parts of the trading day as high-probability windows of elevated activity and deep liquidity. Special focus is directed toward the London and New York sessions, the US equity open, and major macroeconomic data releases — though the exact operational windows and their interpretations differ by author.
- Price Delivery Cycles and Liquidity Manipulation: Burke's Pump & Dump and Dump & Pump models — comprising Frontside, Peak Formation, and Backside phases — share noticeable structural parallels with the AMD (Accumulation, Manipulation, Distribution) schematic used in SMC. In both frameworks, price movement is treated not as random candles, but as a structured process where volume accumulation, false expansion beyond key levels, and subsequent distribution form a cohesive sequence. That said, calling these models direct equivalents is inaccurate: their terminology, identification rules, and underlying mechanics are distinct.
Fundamental differences:
- Minimalism vs. Microstructural Complexity: SMC frequently presents traders with an expansive catalog of concepts: multiple variations of order blocks, breaker blocks, fair value gaps (FVGs), impulses, premium/discount arrays, and more. When multiple overlapping zones compete for attention, this level of granularity can drastically overcomplicate decision-making. Burke, by contrast, strips analysis down to a few core reference points: consolidation zones, prior day/week extremes, and price reaction at those boundaries.
- Entry Mechanics: In SMC, positions are often opened directly at an order block or imbalance zone, frequently via limit orders. This requires a willingness to enter before price provides explicit structural confirmation. Burke takes a more conservative route: he advises against entering purely on anticipation. A peak formation must form first, followed by structural rejection, after which a 5-minute candle close across the 20 EMA serves as the mechanical entry trigger.
- The Velocity Rule: The contrast here is especially pronounced. In certain styles of SMC, a trader might hold a position across extended horizons waiting for a macro move to materialize. In Burke's model, time is an active component of the trade thesis itself. A valid setup must deliver directional momentum almost immediately. If price fails to accelerate within roughly 15 minutes, The Velocity Rule triggers an immediate manual exit. Consequently, the typical duration of a winning trade is just one to two hours.
- Take-Profit Execution: Instead of trailing positions in an attempt to capture the entire macroscopic trend, Burke relies on predefined targets. A Hard Take-Profit is submitted simultaneously with the entry order, typically set at 50 pips (or 75, 100, and beyond for higher-timeframe measured moves). This turns profit extraction into a predetermined execution rule rather than an exercise in guessing how far the market can run.
Ultimately, Stacey Burke's methodology can be viewed as a radically streamlined, pragmatic implementation of the same core market mechanisms that underpin SMC. Burke extracts a handful of essential principles: trapping breakout participants, sweeping stops, and operating within high-volume session windows. He eliminates the rest, distilling complex liquidity concepts into a lean, rules-based decision framework.
However, simplicity should not be mistaken for a proven edge. While streamlined rules are easier to execute and backtest, simplicity alone does not validate the existence of a verifiable statistical advantage.
How testable is the Stacey Burke trading methodology
Let's start with the obvious. Burke's system, as presented in his educational materials, possesses a surprisingly solid logical structure. And that is not mere hype. His methodology features well-defined rules: designated timeframes, clear triggers (20 EMA), specific timing windows, formalized setups, and fixed stop-losses. This is compelling. It creates the impression of a mechanical, testable trading system.
But is that truly the case?

The missing statistical evidence
This is where the problems begin. If you evaluate his course materials through the lens of an experienced trader, the first glaring omission is the complete absence of meaningful statistical evidence. We are shown a massive collection of pristine chart examples featuring textbook entries. But how many total signals occurred across the dataset? A hundred? Five hundred? Or could these simply be 20 cherry-picked winners out of 500 setups, with the remaining 480 resulting in losses? We simply do not know. There is no mention of win rate, average return, maximum drawdown, or profit factor — only a vast library of charts that look flawless in hindsight.
Retrospective analysis vs. real-time trading
Annotating historical charts post-factum (ex post) is effortless and rewarding. When the right side of the chart is fully revealed, it is easy to label any failed breakout a "textbook peak formation" and draw neat consolidation boxes across historical bars. In live trading, however, you do not have that luxury. You are forced to interpret price action in real time. This is why Burke's conceptual framework of "trapped traders" and "forced liquidation runs" is brilliant in theory, but extraordinarily difficult to execute under full market uncertainty — when the next 5-minute bar has yet to print.
The static screenshot trap
A completed static chart inherently contains hindsight bias: you already know how the move was resolved. At the moment of live execution on the hard right edge of the screen, key structural elements look entirely different. What appears to be an obvious reversal on historical data often resembles a powerful trend continuation in real time, fueling hesitation and costly errors. Run a simple test: open any annotated chart from Burke's playbook, mask the right side, and ask yourself whether you would have pulled the trigger at that exact price level before the outcome unfolded.
Where is the data on failed trades?
Now consider the issue of omitted failures. An objective audit of any trading system requires a rigorous breakdown of losing trades. Burke's course focuses almost exclusively on winning outcomes, which introduces classic survivorship and selection bias. Where are the examples where a Day 3 setup failed? Where are the charts where "clean consolidation" suddenly collapsed into a severe loss? They are nowhere to be found. Without accounting for these failures, calculating the base failure rate is impossible, leaving the true edge of the model unverified.
Selection bias
Because the educational material does not define a continuous, unedited historical testing window, selection bias is inevitable. Burke tends to showcase visually clean, textbook market expansions while leaving messy, chop-heavy market regimes out of the frame — the exact market conditions where retail traders suffer their heaviest drawdowns.
The growing pattern catalog and the risk of overfitting
Burke's playbook encompasses a wide variety of setup variations: 20 EMA bounces, parabolic short squeezes, intrasession models, and post-news catalysts. This expanding catalog creates significant risk of curve-fitting (overfitting). Without formal out-of-sample testing, distinguishing between an authentic market anomaly and subjective rule-tuning on historical charts becomes nearly impossible. Concepts such as "clean consolidation" or a "genuine peak formation" are inherently subjective. One trader may identify a textbook peak formation, while another sees nothing more than random noise. This discretionary layer introduces substantial overfitting risk: traders end up seeing what they want to see.
Descriptive power vs. predictive power
Burke's methodology exhibits exceptional descriptive power: it offers a cohesive, elegant narrative explaining why price behaved the way it did on a completed chart. However, high descriptive utility in hindsight does not guarantee predictive reliability when forecasting future price action. Without rigorous backtesting across historical data, that predictive edge remains unproven.
Causal narrative vs. empirical evidence
On paper, the system's causal logic is compelling: trapped market participants → stop-loss execution cascades → forced liquidations → vertical price expansion. It represents an intuitive and logically structured auction model.
Nevertheless, drawing annotations on a chart does not verify the actual underlying distribution of volume or open interest. Without verifiable order flow and positioning data, the narrative of "trapped longs" remains a plausible yet strictly unverified hypothesis.
Which setups are more testable?
Not all elements of Burke's system are equally testable. Setups governed by explicit, rule-based candle closes (such as First Red Day, First Green Day, and strict three-day counts) can be easily codified and subjected to quantitative backtesting. Conversely, discretionary concepts such as "clean consolidation" or a "true peak formation" remain too vaguely defined and depend entirely on the subjective interpretation of the individual trader.
What does a full independent audit require?
To objectively validate the viability of this methodology, a trader must establish unambiguous entry and exit parameters, utilize uncurated historical datasets (avoiding cherry-picked samples), account for live spreads and execution slippage, and run forward-testing in real-time market conditions — none of which are provided in the educational examples. It also requires maintaining an unbroken trade log. Ironically, neither the author nor his community has published verifiable records of this standard. While the lack of a publicly audited track record does not inherently disprove profitability, it prevents any formal empirical validation of the edge.
Public results and independent verification
The course materials lack third-party audited broker statements or verified live track records (such as Myfxbook or equivalent monitoring platforms). The absence of public verification does not prove the author is unprofitable. However, from the standpoint of rigorous financial analysis, the system's real-world profitability remains a matter of personal trust in the educator rather than an empirically substantiated fact.
The hierarchy of evidence in trading
| Level of Evidence | What It Proves |
|---|---|
| Single Screenshot | A single historical market example |
| Curated Screenshots | Evidence that similar patterns recur in market structure |
| Full Historical Sample | The actual historical win-to-loss distribution |
| Formalized Backtest | Expected return and edge under fixed, rule-based constraints |
| Out-of-Sample Testing | Model robustness across unoptimized market regimes |
| Verified Track Record | Realized profitability under live execution conditions |
| Independent Replication | The ability of third-party traders to replicate results using the same rules |
The final balance of rules, subjectivity, and evidence
How should a trader approach Burke's methodology? The answer requires objective analysis rather than blind faith. If the goal were to establish high institutional confidence in the system, an independent audit would be the logical next step. That would demand a strictly defined ruleset applied across an unbroken historical dataset, full accounting for real-world transaction costs, and complete transparency regarding overall performance metrics.
Currently, none of these components are available. As a result, the methodology remains an interesting, conceptually sound trading hypothesis, but without independent verification, its statistical edge cannot be treated as proven fact. In short: the concepts may hold merit, but conclusive empirical proof has yet to be provided.
What the evidence really says about the Stacey Burke methodology
In summary, Stacey Burke's course presents a cohesive and internally consistent framework for a professional trading mindset. To define market structure, he has replaced abstract concepts with concrete system elements: the three-day cycle, trapped liquidity, and strict timing windows for execution. At the same time, Burke instills high trade selectivity supported by a disciplined risk-management framework focused on asymmetric risk-to-reward ratios. This is undoubtedly a positive aspect that can help beginner traders cultivate discipline and avoid chaotic, emotional trades.
Let's look deeper, however: what remains plausible yet unproven? Consider the claim that daily structure (Day 3, Day 5, etc.) holds predictive power. It sounds compelling. The premise that the market moves in cycles and that specific days provide an edge is a longstanding hypothesis. It is conceptually logical, but where is the empirical data? Where are the large-sample backtests showing that this dynamic outperforms random chance? Unfortunately, they are absent. The same holds true for the session timing windows. Do they genuinely provide an edge? Quite possibly. Yet this remains untested. And what about the mechanics of "trapped traders"?
The concept that cascading stop-losses purge participants from their positions and fuel a structural reversal has existed almost as long as financial markets themselves. It is an elegant, intuitive narrative. However, the narrative itself does not constitute proof; it remains a hypothesis that requires validation through actual order flow data, liquidity distribution, and institutional positioning.
Furthermore, this interpretation substantially oversimplifies real-world market microstructure. It largely overlooks participants whose orders are driven not by speculative profit, but by commercial hedging needs. These commercial hedgers — commodity producers, airlines, exporters, importers, and multinational corporations — enter the market primarily to manage price exposure.
For these entities, a position may remain economically rational even when price moves sharply against it. Their decision to adjust or liquidate is dictated far less by chart patterns and stop-loss placement than by core business requirements, physical asset exposures, delivery schedules, and overall hedging structures.
For this reason, the concept of "trapped traders" within Burke's framework warrants a degree of skepticism. While price reaching a specific level may indeed trigger a cluster of stop orders and accelerate momentum, not every participant caught on the other side of the trade is a retail speculator forced into immediate capitulation. Diverse, non-speculative economic motives often drive underlying market positions.
What is the bottom line? The methodology offers a structured and logical system for interpreting market behavior, but hundreds of compelling historical chart examples do not prove the existence of a sustainable statistical edge. The central question remains: how effectively do patterns that appear obvious in hindsight (ex post) hold up during live, real-time decision-making and execution (ex ante)? Only systematic data collection and independent verification can provide that answer.
Until this gap is bridged by independent testing and verified track records, it is more accurate to view the methodology as an intriguing trading hypothesis rather than a proven blueprint. Ultimately, the choice rests with the trader: to accept the author's framework on faith or to demand quantitative verification. In the end, the market demands verifiable evidence over belief.
FAQ
Is day 1 always Monday?
No, Day 1 does not always occur on Monday. As a rule, Monday establishes the week's Opening Range (OR). The structural Day 1 / Day 2 / Day 3 count is anchored to the development of price structure. For example, a cycle can kick off on a Friday or following a news-driven false breakout in the middle of the week.
What is the difference between a three-day setup and day 3 longs/shorts?
The difference between the Three-Day Setup and Day 3 Longs/Shorts is that the Three-Day Setup is a multi-day pattern of accumulation and reversal formation on the 15M/Daily timeframe, whereas Day 3 Longs/Shorts is a pattern of consecutively breaking the extremes of the last three days in one direction. For instance, Day 3 Longs occur when the highs of the last three days have been broken, while Day 3 Shorts occur when the lows of the last three days have been broken. In both Day 3 Longs/Shorts patterns, breakout traders enter at the tail end of the trend impulse and get trapped — an opportunity Stacey Burke recommends capitalizing on by taking counter-trend trades once the reversal is confirmed.
Does the 20 EMA generate trade signals on its own?
No, the 20 EMA does not generate any trading signals on its own. The 20 EMA on the 5-minute chart serves purely as a mechanical execution confirmation filter after the trap structure and Peak Formation have already formed on the 15-minute chart.
Does this methodology allow holding positions overnight or over the weekend?
No, this strategy does not hold positions overnight or over the weekend. It is strictly an intraday (day trading / session trading) system. If the planned take-profit target is not reached within a few hours or momentum dies out, Burke recommends closing the trade without waiting for the end of the session. Carrying positions overnight is strictly forbidden.
How does Stacey Burke handle high-impact news releases?
Stacey Burke never holds open positions directly into high-impact news releases (NFP, CPI, FOMC). He uses news solely as a momentum catalyst, after which an entry is taken strictly via the First Bounce setup (on the first technical pullback on the M1 chart), provided that a trade setup was already established on the M15 timeframe beforehand.
Can this system be automated via an expert advisor (EA)?
Fully automating this system is extremely difficult. Although the entry rules — such as the 20 EMA trigger, session timing (3-hour windows), and risk management (hard SL/TP) — are well-formalized, key preparatory steps like assessing consolidation quality, identifying trapped volume, and selecting the best instrument from the watchlist remain largely discretionary.
What markets are best suited for this methodology?
Highly liquid markets with distinct session volume profiles are best suited for this methodology: major currency pairs (including yen crosses for the Asian session), spot gold (XAU/USD), WTI crude oil, and key US stock indices (Nasdaq 100, Dow Jones 30, S&P 500).


